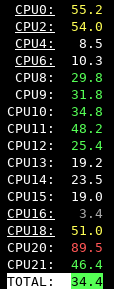
Building on a wave of inspiration thanks to @queen and @renehoj in this thread, I am releasing another nice little utility for Xen/Qubes that has already come in handy a ton for me.
It lets you monitor the usage of all your CPU cores right from dom0, something which I don’t believe was possible save for the solution linked above or manually writing a parser for xenpm start (which is what this script is).
The column count, underlining and totals field is easily customizable (through commandline arguments) and you can also change the colour thresholds, by editing the script itself.
Hello,
I am using Qubes for while now. But, how do I copy command into dom0?
If the github repo is a programm, how do I install it?
That is really something, what bothered me, that I cannot see the overall CPU load. Because I am using an older CPU and sometimes my browser crashes. I don’t know why this is.
It could run in a “sys-top” so you don’t have to drag all the status info you need to collect from the VMs into dom0. I really wouldn’t mind having one extra VM for a nice proper top style monitoring tool.
The only thing better would be an actual monitoring tool (prometheus is my fav), but sth small like this would serve a LOT of users I think.