I’m working on a conky config file, and I would like to add the total CPU load percentage.
xl doesn’t seem to show the load value for the CPU or cores, I’m currently using xenpm to try and calculate the load, what is the best way to do this?
I’m working on a conky config file, and I would like to add the total CPU load percentage.
xl doesn’t seem to show the load value for the CPU or cores, I’m currently using xenpm to try and calculate the load, what is the best way to do this?
Reading this issue might help a little:
It that not the virtual load on each guest, the same as you get with xentop?
I want the actual load on the physical CPU.
I have been also looking to that. It appears that there is no way but to work with the Xen API. As the actual physical CPU load is managed by it.
Currently, I’m sampling xenpm with 1s, then I take the time spend in the p0 state as the load.
eg. with 16 cores, the total execution time 16x1000ms, if the total P0 time is 1600ms on all cores, the load would be 10%
But I don’t know how accurate this is.
Very good information. Have you checked xenpm get-cpufreq-para 0 ?
The cpuinfo frequency for max, min and current.
I am looking at the source now.
I tried all the options, xempm start 1 makes the most sense to me.
I don’t really care if the CPU is boosting or not, the speed of the CPU is going to be dynamic, 100% isn’t always the same actual performance.
xl doesn’t seem to show the load value for the CPU or cores, I’m currently using xenpm to try and calculate the load, what is the best way to do this?
Good question.
Don’t know but would like to as I’ve wanted this before. I’d hope this was available directly in Xen - maybe ask on a Xen list?
Using the C0 or P0 value seem to work.
My system only uses the P0 state, if your system is using multiple P states, then using C0 is probably best.
So, how exactly do you get the actual CPU load?
I use xenpm start 1
The total execution time will the number of cores x 1000ms, and the time each core isn’t idle is the time spend in the C0 state.
e.g. with 16 cores total execution time is 16000ms, and if the sum of the C0 state is 1600ms, you know the CPU hasn’t been idle for 10% of the time.
Do I understand correctly that:
The minimum polling time in seconds is the number of cores and there is no direct way to get a single number (%) of the CPU load?
If that is so, it is not quite convenient for real-time monitoring.
As I understand it, the “xenpm start 1” command polls for 1 second, and will display the average utilization per CPU in the C0 line.
Running something like:
xenpm start 1 | \
awk 'BEGIN {sum=0;tot=0} \
          /^  C0/ {tot++; sum+=$2 } \
        END {print "CPUs: "tot, "\nActive ms.: "sum, "\nPercentage utilization: "sum/tot/10}'
shows the number of CPUs, Total milliseconds active during the 1s measurement time, and the respective percentage of CPU load across the N CPUs.
Running this every 10-15 seconds can be enough for a rough percentage display on the taskbar.
Yes, that is how I use it. I run it every 5s with Conky, and use the output to get the total load on my E and P cores.
On my system, the only P state that is used is P0. I think this makes the value somewhat accurate, the CPU is either idle or full on. It doesn’t account for any difference in performance of P0 do to changing clock speed, but I don’t know if an OS is aware of the actual effect of P0 when measuring CPU load.
That’s certainly the right way to proceed. On Linux there is a sysctl that have the time passed in each CPU modes (idle, user, steal, nice etc…), so you just have a CSV of long values, you need to calculate the diff between two measurement and knowing the time between the two to calculate the CPU usage.
What you found in xen looks so similar that it’s certainly the right way to proceed ![]() I don’t think this value exist at all, ready to be use, as it would be meaningless without an associated time sampling, which in turn would be a waste of CPU cycle to keep it somewhere “in case someone need it one day”.
I don’t think this value exist at all, ready to be use, as it would be meaningless without an associated time sampling, which in turn would be a waste of CPU cycle to keep it somewhere “in case someone need it one day”.
Thanks @barto!
Here is my script based on your idea:
#!/usr/bin/env bash
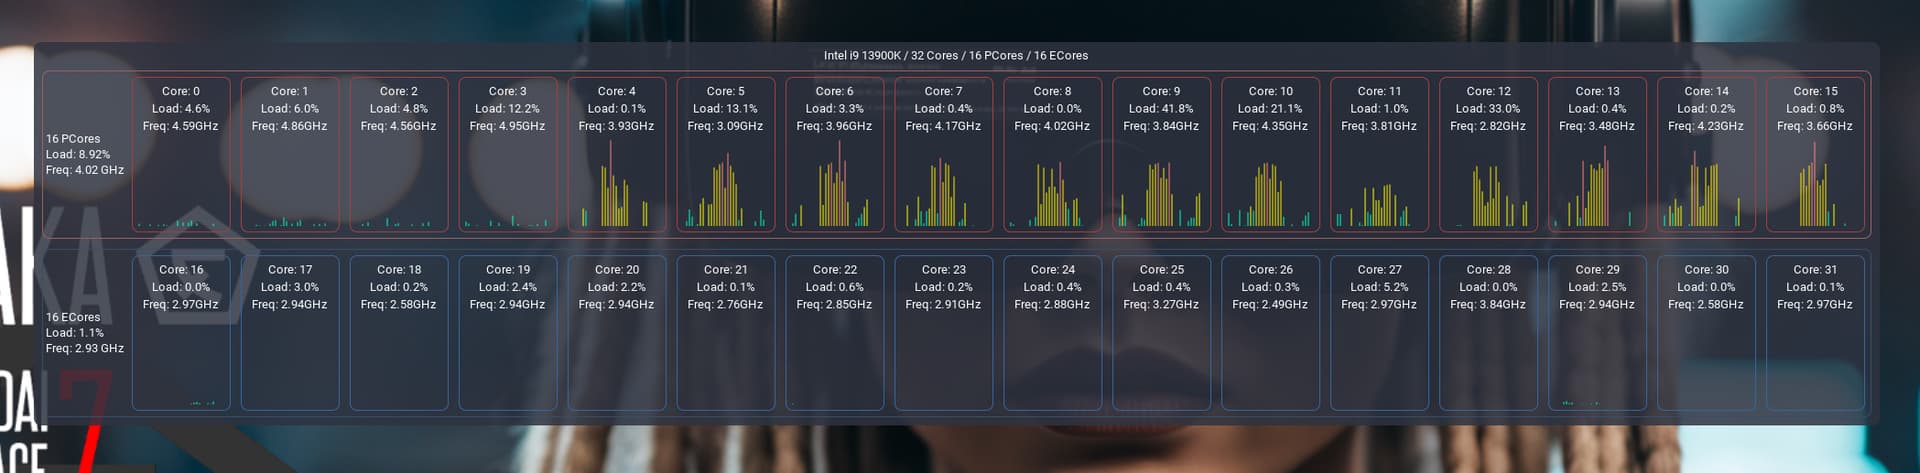
# Measure physical CPU load in XenMade a very simple python app to show the current frequency and load for each core, and the load for the last minute as rolling data.
very beautiful !
FYI, on Discourse the text of your script was truncated, at least for me. Could you try sharing it again?