It caught my eye while I was browsing prs for the admin client. An attempt to have an alternative to the beloved but oh-so-information-packed and w i d e xentop. It have been worked on by Ben for more than a year at this point, and still going.
Now it’s dirty cause I have added too many columns and all are enabled by default. I will reduce the amount of default columns and users that want them, can have more with --columns option.
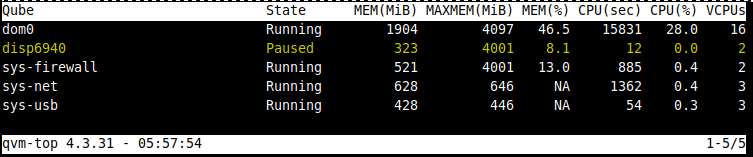
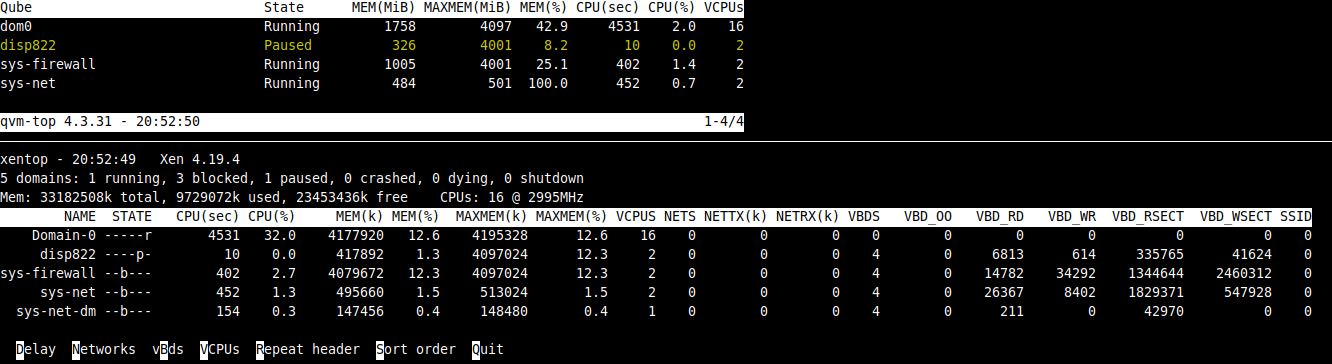
Qubes doesn’t want to report stubdomains to clients. As of now, stubdomains values are aggregated, that is why you see sys-net and sys-sb with 3 vcpus and more memory etc. What I could do is make the server report separate details for stubdomains, then the client could display those information in separate columns instead of aggregating. Also, most of the information of stubdomains aren’t “live”, HVMs and stubdomains do not have qmemman agent installed and we can’t know how much memory they are using inside, just how much it is allocated to them. The only usage(%) valuable for stubdomains is CPU usage.
Why not? This is one of the things that make qubes distinct from conventional vms.
Does it matter? I would expect a tool like qvm-top to be mostly concerned with how much memory is reallocatable to other purposes, not strictly speaking used. In that case declaring full allocation to an HVM as “used” is perfectly fair.
For example, when a user wants to understand why they don’t have enough memory to start another qube, only total allcation to HVMs matters.
Besides, it would allow displaying unknown MEM(%) for stubdomains correctly and separately from the domain value (that might be correct)
I’m arguing for the tree mode as an alternative view to the aggregate mode. It aligns reasonably well with things like htop, but unlike them doesn’t have the disadvantage of trees getting too big sometimes. For now.
I don’t have a real argument though, it just feels right.
is this supposed to run in dom0? i think communicating more detailed information would be lovely for a top monitor, but if its being parsed in dom0 that might not be ideal. if its all collected in a vm just for that purpose, and that VM is only allowed to collect info and not send info to other VMs, that would be fine with me.
Because they are implementation details. They are separate domains but stubdomains are not really qubes, they are never registered as qubes on the server nor in the client. The idea is, independent of Virtual Machine Monitor we use, which might have separate domains that consume resources, we only show qubes and aggregate values or show in tree mode.
memory_used / maxem = MEM(%), but HVMs and stubdomains have maxmem set to 0, so either way we can’t display the memory usage. I could display 100%, but that is not true, we (Qubes, Xen, Libvirt) don’t really know the memory being actually used. On the image at the end of this post, you will see detailed memory information.
Tree mode can also be done, but the string sys-net-dm won’t be reported to clients. Client’s will only know there is a separate consumer of resources for that domain.
This is supposed to run in any privileged qube you have. The information being shown is queried from the API, so it’s restricted in the same way. An interface qube (previously called GUI domain), such as sys-gui-vnc that only have access to certain qubes, will only show information that it is allowed to know. I haven’t tested on non-dom0 yet to know if it’s working as expected. It doesn’t really need to be an interface qube, just a qube that you allow certain policies.
About being parsed in dom0, most of the information I am parsing is trusted, and what is not trusted, queried from the domain such as xenstore keys, is sanitized first. It also can only be queried from dom0 unless you change xenstore permissions for a key.
There is no color mode for those that don’t like any color. Only reverse video is applied to highlight fields
Colors are controlled by your Xresources.
I am using --format max, so it shows all columns, default view is way cleaner.
Small summary at the top
State and percentage values are colored
Almost everything can be done without a mouse, such as choosing the header for sorting, inverting sort, navigating the pages. One thing that still requires a mouse is clicking a line, but that currently doesn’t do anything. In the future, it should allow to control qube state, such as restart, shutdown, kill etc. The line I have selected is yellow, but on this terminal, it’s very orange.
well you can send information from dom0 to a vm. That would not be a security risk to dom0 (you have to know what to send ofc, but the vm cant influence what dom0 sends).
If you send data from a vm TO dom0, or better said have dom0 run something inside of a vm and then gather that data, to later parse it, that might be a way into dom0 from that VMs perspective, if it can abuse the parsing that happens in dom0.
Hence my question. I also tried to script a bit of a top monitor together a while back, but was afraid to gather data from VMs and parse it in dom0, bcs I cant really control that vm sending the right data. Simplest example:
qvm-run --pass-io vm "cat /gimme/dat/data" | parse-things-here
I’m sure you use a more fancy mechanism, but at the end data FROM the vm is parsed in dom0. That is the nature of my question.
If the VM parsing the data is not dom0 but some VM named “top” or whatever, that would be a whole different thing.
Or I misunderstood you, not sure.
Btw love what you’re building and the looks of it so far!
Depends. It is correct to apply for most cases, the perspective that sending data from less trusted domains to more trusted domains is risky. In the case of qvm-top, the situation is different. Please read my post above:
Information is fetched from the VMM, and it is just integers, a domain cannot report strings in those fields. There is no qrexec communication passing stdin/stdout/stderr, so no string parsing from untrusted sources. Also, this was already the case before my PR, as you can see in the link above.
We don’t know, thus N/A is a correct answer. That is what I mean by “displaying unknown MEM(%) for stubdomains correctly and separately”. Otherwise, if you aggregate memory (not maxmem) from stubdomain and domain, you are forced to lie about MEM(%), are you not?
By separating them into tree you can display truth for both: real percentage for domain, real “I have no idea” for stubdomain.
I tested with a HVM StandaloneVM from fedora-44-xfce which has memory balancing enabled. Values that are wrong:
MEM_SET(MiB) > MEM_MAX(MiB) and therefore, MEM_SET/MAX(%) > 100%`, because value is aggregated with stubdom
MEM_USED has a fixed amount of memory of the stubdomain plus volatile memory managed by qmemman, as the value is aggregated, we can’t distinct between what the qube is using and what the stubdomain is using. The standard fixed amount is 144MiB but can be customized with stubdom_mem.
Note that values for MEM_SET is only shown when specified or format is max, not in the default view. Those values don’t show NA, but they show misleading (but not too misleading) values. I will leave a TODO for this, to broadcast values used by stubdomains.
Not specific to HVMs, but any qube that reports a high meminfo due to swap, caj have MEM_USED(MiB) bigger than MEM_SET(MiB) and MEM_MAX(MiB) and their usages (%). Theoretically, I could fix this by reporting memory consumption and swap usage separately in the qube’s qmemman agent.