The CPU graph can be observed either with Task Manager or in the Panel
-
How do users make use of this information?
-
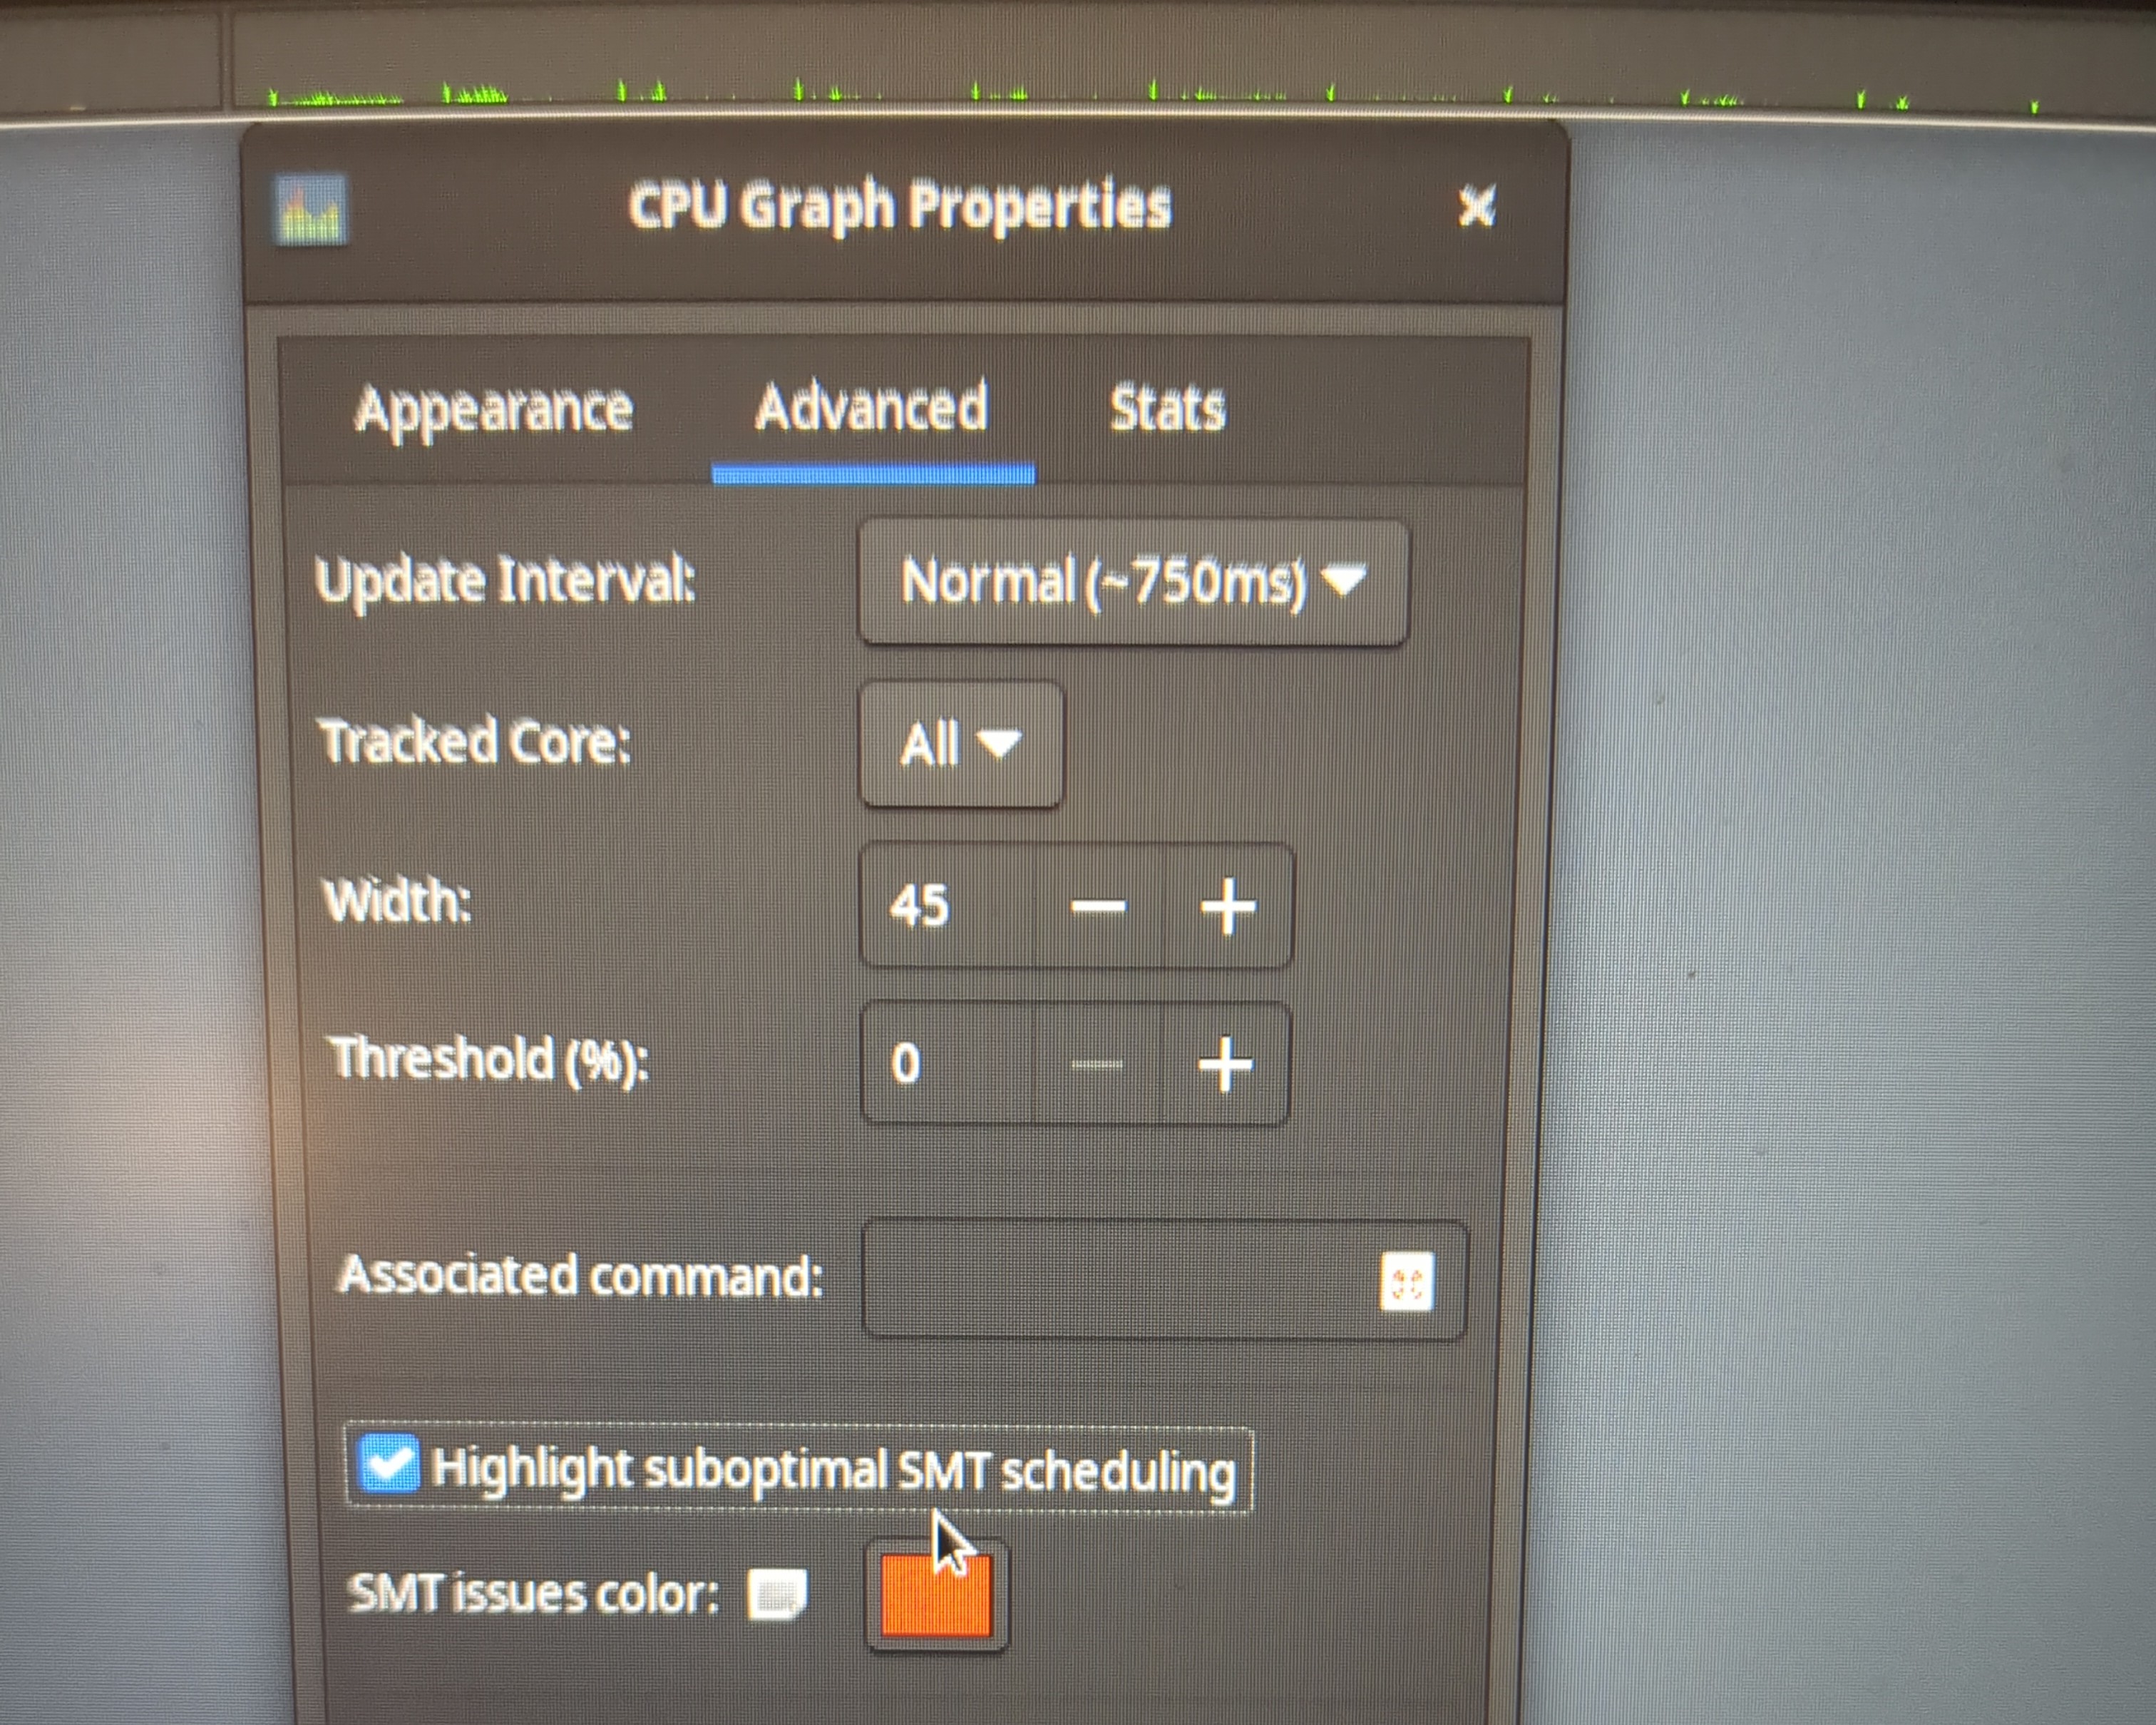
What is “suboptimal SMT scheduling,” for example, and how can it be optimized?
Topic on CPU pinning might be referenced here] -
Can anyone shed light on the cause that explains the following observations?
I have an anomaly I am trying to get more information on which is indicated by high heat and high fan speed. [“Settings gear”–> Other → Sensor Viewer - in R4.2] CPU heat is supposed to trigger an EC sensor which turns on the fans. However, CPU graph monitors display that the CPU is only at around 1% but the fans are at the highest speed and the chassis is hot. I don’t want to imagine how hot 90% would be. Automatic shutoff before melting? Certainly no fire. Why is this happening and how should I go about troubleshooting the issue?